Introduction
Phylogeny is the study of the relatedness between organisms from an evolutionary perspective. Phylogenetic analyses can be done using a variety of data, from morphological characters and measurements to DNA and protein sequences. As one might expect, the more data points available, the more potential for a high-resolution look into the relationships of your study samples. [1]
Phylogenetic analyses can be run using a variety of algorithms and tools. One such tool is MEGA7, which allows the use of multiple different algorithms. After assembling a library of orthologs for the human HGD protein, I used three of these algorithms to generate phylogenetic trees based on the protein sequence data. Below, I will walk through the alignment step of these analyses and then through the different algorithms and the results they yielded.
Phylogenetic analyses can be run using a variety of algorithms and tools. One such tool is MEGA7, which allows the use of multiple different algorithms. After assembling a library of orthologs for the human HGD protein, I used three of these algorithms to generate phylogenetic trees based on the protein sequence data. Below, I will walk through the alignment step of these analyses and then through the different algorithms and the results they yielded.
Results
Sequence Alignment
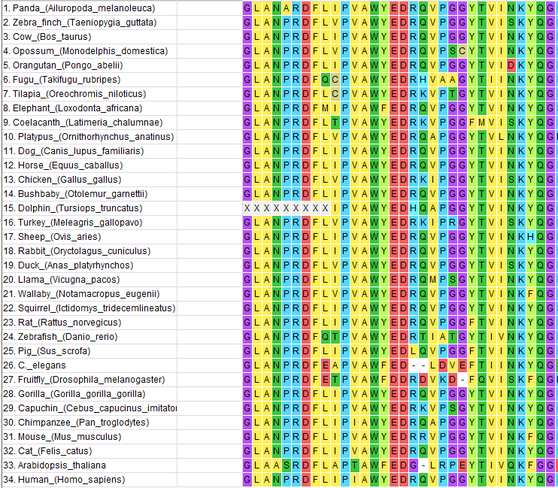
The protein sequences for 33 orthologs to the human HGD gene, as well as the protein sequence for the human HGD gene, were all pasted into a FASTA format text file. This text file is constructed by simply pasting the ortholog sequences into a text file, making sure to also include the header (the line starting with ">"). The sequences were aligned against each other using ClustalW, an option available within the MEGA7 program. Below is an example of the graphical output and the file output generated by ClustalW.
|
| ||
Phylogenetic tree generation methods
|
Neighbor joining is the one of the simpler methods used in phylogenetic analyses. It involves grouping the two samples with the least amount of differences together, grouping that group with the sample with the least amount of differences from it, and then continuing until all samples are a part of the group. While this method is simple, and therefore computationally easy, it also has problems with long branch attraction. Long branch attraction is a problem that occurs with methods based primarily on maximum parsimony, that is that they favor the simplest result. This bias often results in highly divergent groups being grouped together, even if they aren't especially similar to one another. [2]
|
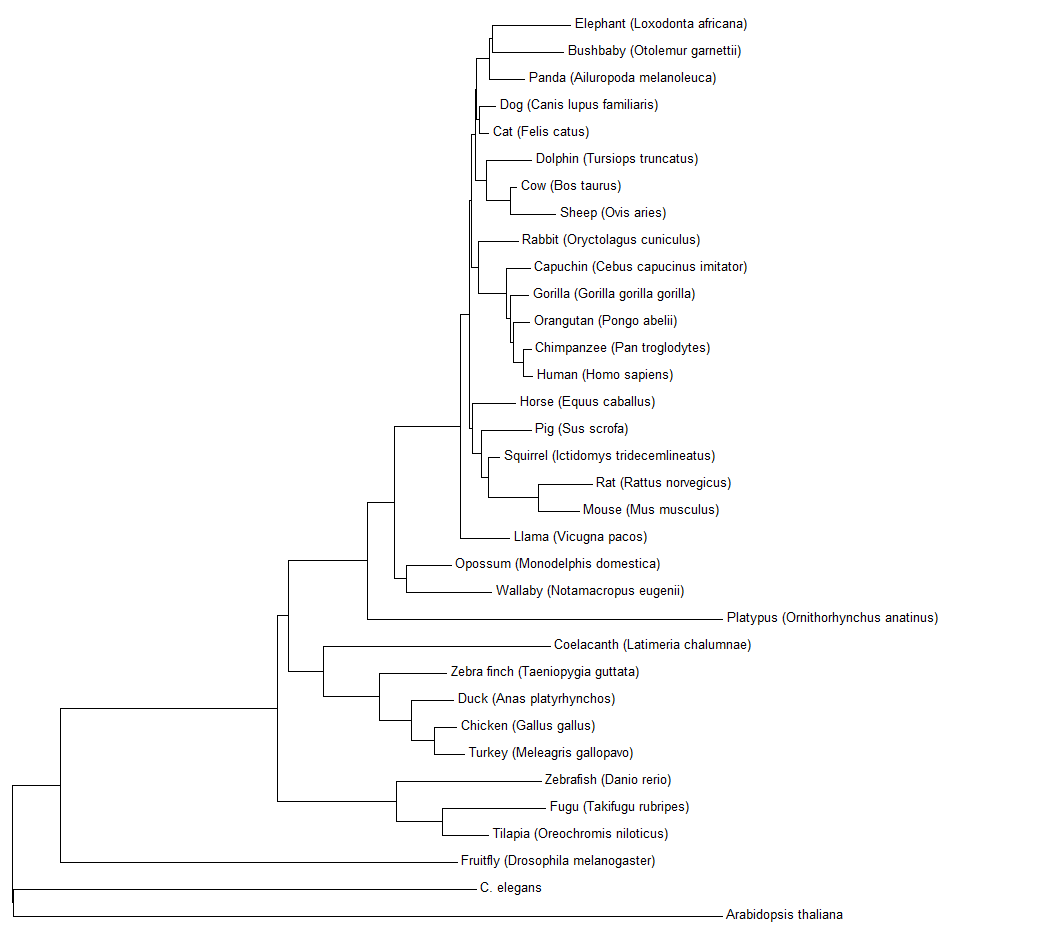
Fig 1: The results of using the neighbor joining method in MEGA7 on 34 different HGD orthologs.
|
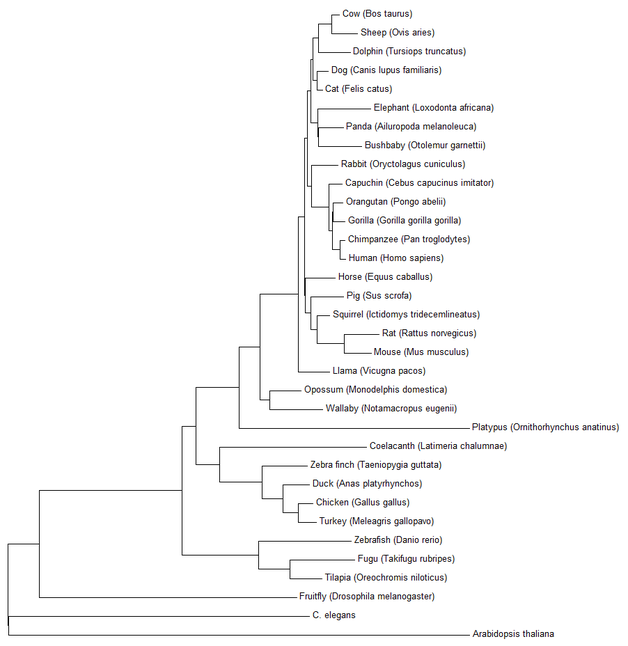
Fig 2: The results of using the minimum evolution method in MEGA7 on 34 different HGD orthologs.
|
Minimum evolution is a method similar to neighbor joining in that it is based on maximizing the parsimony of the result. Because of this, it too can have issues with long branch attraction. However, it differs from the neighbor joining method in that it generates a tree with the minimum amount of total transitions (represented by branch length) throughout the entire tree. It is another computationally "cheap" method for phylogenetic analyses [3].
|
|
Maximum likelihood methods are the most complex and computationally intensive method used in my analyses. It relies on using methods like neighbor joining to generate a preliminary tree, and then uses models for nucleotide or amino acid substitution rates to find the tree that is a good balance of both parsimony and likelihood of substitutions occurring [3].
|
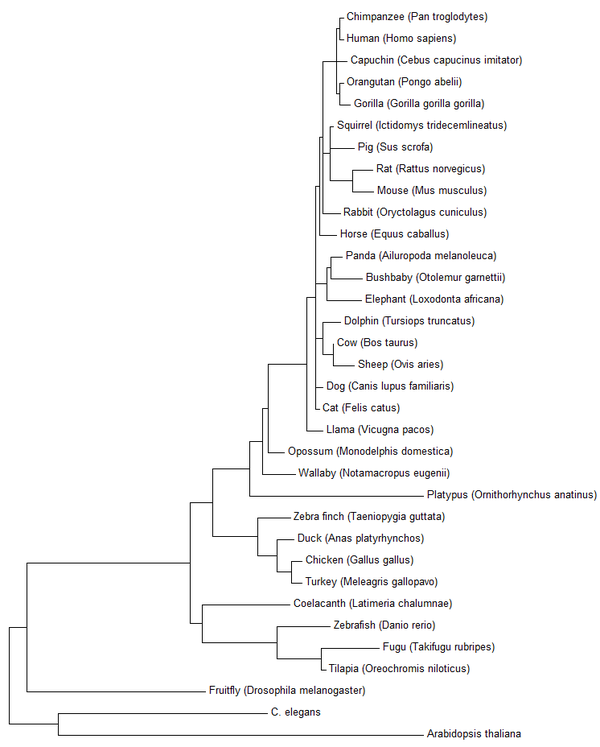
Fig 3: The results of using the maximum likelihood method in MEGA7 on 34 different HGD orthologs.
|
Discussion
Examining the phylogeny of a gene can provide many good insights. For the analyses I'm interested in, the most important aspect of this phylogenetic analysis is the protein alignments. HGD is a relatively short and relatively highly conserved gene, as it is involved in an important and simple biological process (the metabolism of tyrosine). Because the gene is so short, visually identifying parts of the protein that are more highly conserved across a wide range of taxa can show which segments are most likely to be crucial to the functioning of the protein, and therefore good targets for a gene function knockout via CRISPR/Cas9.
|
References
[1] Kumar, S., Stecher, G., & Tamura, K. (2016). MEGA7: Molecular Evolutionary Genetics Analysis Version 7.0 for Bigger Datasets. Molecular Biology and Evolution, 33(7), 1870-1874. doi:10.1093/molbev/msw054 [2] Saitou N. and Nei M. (1987). The neighbor-joining method: A new method for reconstructing phylogenetic trees. Molecular Biology and Evolution 4:406-425. [3] Rzhetsky A. and Nei M. (1992). A simple method for estimating and testing minimum evolution trees. Molecular Biology and Evolution 9:945-967. |
Image references:
Header: https://3c1703fe8d.site.internapcdn.net/newman/gfx/news/hires/2015/treeoflifefo.jpg |
