Introduction
|
Transcriptomics is the study of the quantity and identity of DNA transcripts. Typically, this is done by taking the messenger RNA (mRNA) from a cell and sequencing it via RNAseq. This sequencing technology is very similar to other next-generation sequencing technologies, but differs in that it has a first step of creating DNA strands complementary to the mRNA via reverse transcriptase. Microarrays are another potential technique to use in studying the transcriptome, but is becoming less widely used due to its higher cost and the lower amount of information gleaned.
|
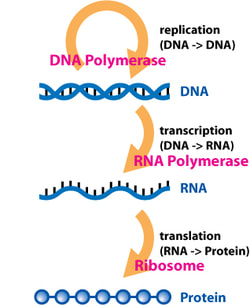
Figure 1: The central dogma of biology is depicted. Transcriptomics focuses on the second step, transcription.
|
Results and Discussion
Understanding the quantity of transcript produced can be key in understanding the body's response to a stimulus or disease. In my case, doing tissue-specific RNAseq could help see if the dysfunctional HGD gene, or perhaps the genes involved in endogenous vitamin C synthesis, are up-regulated in mice with alkaptonuria. A good way to visualize such relationships is through GEO Datasets and the cluster maps that accompany them [2]. While there are none available for alkaptonuria or HGD, generating one would be a good step towards understanding the scope of the effects of alkaptonuria on the body.
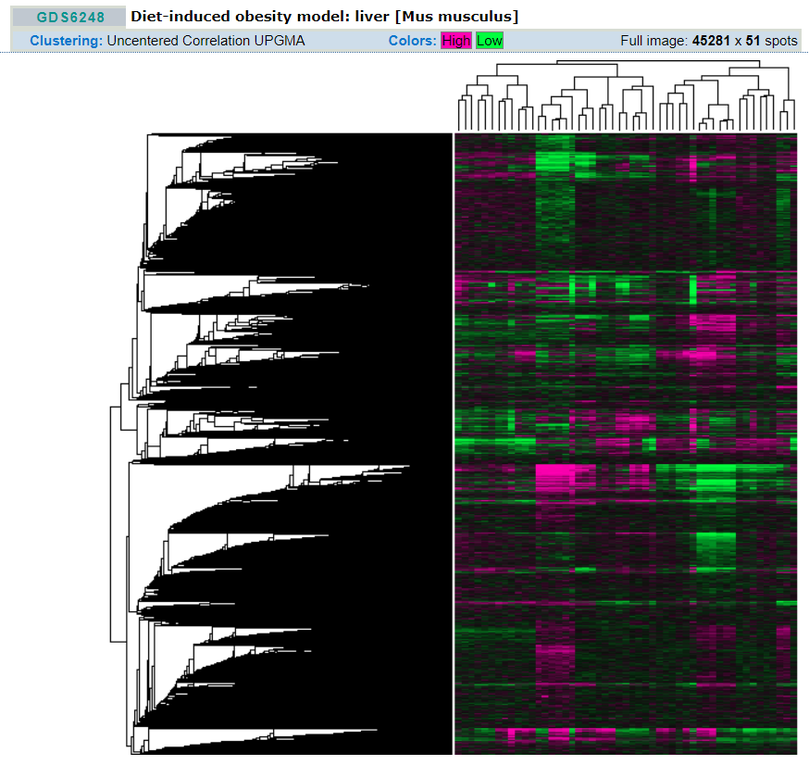
Fig 1: An example of a GEO Dataset cluster map. This allows users to easily identify which genes are affected by the experiment and in which way. The genes are clustered by similarity of function, so the results are even more accessible.
|
References:
[1] Wang, Z., Gerstein, M., & Snyder, M. (2009). RNA-Seq: a revolutionary tool for transcriptomics. Nature reviews genetics, 10(1), 57. [2] Edgar R, Domrachev M, Lash AE. Gene Expression Omnibus: NCBI gene expression and hybridization array data repository Nucleic Acids Res. 2002 Jan 1;30(1):207-10 |
Image references:
Header: https://www.wellesley.edu/sites/default/files/assets/dailyshot/ds_dnarna_tablet.jpg Fig 1: https://upload.wikimedia.org/wikipedia/commons/6/68/Central_Dogma_of_Molecular_Biochemistry_with_Enzymes.jpg |
